
Monitor and analyze your marketing campaigns within HubSpot
A well organized HubSpot dashboard can give you a concise overview of your marketing achievements, identify opportunities and spot weak spots in your strategies. Each dashboard is limited to ten reports, meaning you need to choose wisely when selecting the data points you’d like to see. While this may be daunting at first, it is inline with the goal of using the dashboard to get a quick overview of your marketing activities. Though dashboards in a new portal are pre-populated with template reports, we recommend updating and customizing them to suit your objectives.Before you begin organizing your dashboard, take a moment to consider your primary marketing goals. HubSpot reports can be customized to report across single or multiple data sets, as well as funnels, pipelines and attribution paths. You may also select from multiple options for visualizing the data. This makes it easy to be sidetracked and build a board that presents data that is interesting but not important for your review.
A good way to keep your dashboard focused is to ask “what is the first question I’m asked when others are evaluating the success of our marketing activities”? Another thing to consider are the KPIs your leadership team need to manage the business - this is usually sensing data such as average time to close, average selling price, etc., vs, more detailed “pre-funnel” metrics. Dashboards can be emailed automatically and on a recurring basis, such as for monthly planning meetings, so consider what reports would be helpful for this purpose.
Starter and Professional accounts are limited to three dashboards with a max of ten reports each. Enterprise users get more flexibility and may have up to 50 dashboards. Need more than your account comes with? The reporting add on may be purchased by any Marketing Hub user and supports the creation of 200 custom dashboards. We’re big proponents of Professional and Enterprise users customizing their boards to best reflect their use cases. Here are some of our favorite reports to include on a dashboard.
Default reports on a HubSpot Marketing Dashboard
Your default dashboard will contain these reports and we recommend keeping them unless you feel they truly add no value for your goals monitoring and reporting.
Marketing Performance - This report gives an overview of sessions, contacts and customer growth over time. Be mindful of the “include offline sources” checkbox in the top right. If you often upload contacts, you may want to exclude them from these metrics so you get a true view of inbound activity.
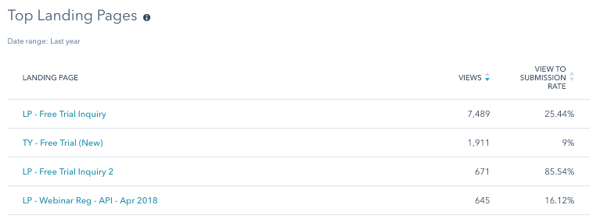
Top Landing Pages: Identify which pages have the best conversion rates. Build new content based on these insights and leverage high performing content for email or social media campaigns.
Blogging Performance - Get a high-level understanding of the traffic your blog generates for your site. Monitor views and bounce rates compared to prior periods and consider factors that may contribute to changes to each, such as a new content strategy.
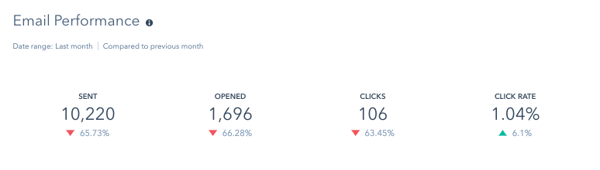
Email Performance - Monitor how engaged your contacts are with email and get ahead of deliverability and engagement issues. This sections contains automated and standard emails, so keep in mind that follow-up emails will inflate this as most people will open them to get their promised content.
Top Emails - We like this as a complementary report to the slightly higher-level Email Performance report. Hone in on which marketing emails are driving results by reviewing their opens, open rate and CTR.
Adding Marketing Reports from the Report Library
The following reports are available in the Report Library. Select the orange “Add Report” in the top right of your dashboard and use the left hand menu to add them.
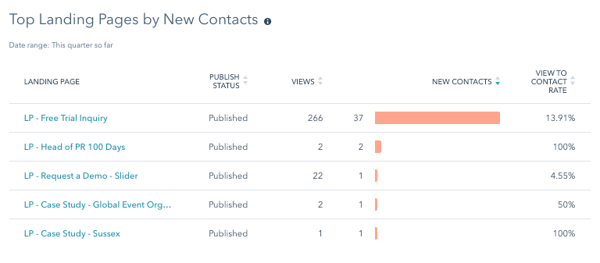
Top landing pages by new contacts or customers - Place this next to your Top Landing Pages report to add greater detail to your conversion information. If you’re focusing on growing your database and attracting new prospects, select Top Landing Pages by New Contacts. Otherwise, we like the “by New Customers” view. In either scenario, identify the content that best supports your goal so you can use it in email and social campaigns and base new content strategy off it.
Top Blog Posts by CTA Click-through Rate - If you're publishing your blog with HubSpot, use this report to understand which posts are best at converting traffic. Identify trends in the topics or nature of the posts and use these to craft your editorial calendar.
Custom Reports to Add
Leads Qualified - Create this report based on the lifecycle status property (in this example, Opportunity) to monitor the quality of the Inbound leads you’re generating. If conversion rates are high but qualifications are low, you may need to rethink your content strategy (or your business development rep). 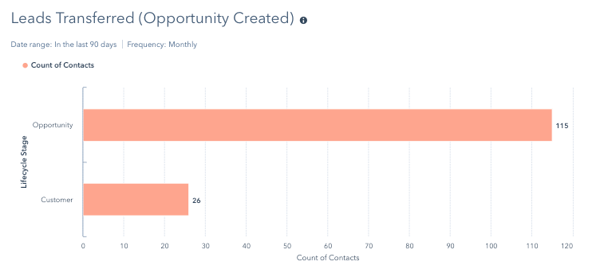
As you create your dashboard, make sure to keep the focus on the important KPIs for you to be monitoring. It is natural to review a report, have follow up questions and want to create additional reports to add context. Do so judiciously and you’ll have a strong tool to guide you and your strategy.
Want to get more tips like this? Sign up for the blog and never miss a post!